.png)

Mortgage rates, including DSCR Loan rates, are driven significantly by the yields, or market rates, on US Treasury bonds, particularly the US 5-Year Treasury Notes and 10-Year Treasury Notes. DSCR Loan “base rates” are typically calculated daily based on a “spread” plus the current 5-Year Treasury Note yield, before adjusting for loan-specific adjustments, like the qualifying credit score and DSCR ratios, among other “LLPAs.”
Although the US Treasury market is gigantic, with an average of over $918 billion (!) in volume traded daily, and the US government issues (sells) new bonds in auctions approximately 300 times per year, these new issuances do affect the overall market yields, and thus are another thing to watch for real investors aiming to track mortgage rates. Treasury actions can have just as large an effect on DSCR Loan rates as some key economic report releases or instances of “Fedspeak,” however, the reporting by the financial media on how to interpret the Treasury auction results are unfortunately extremely difficult for even the sophisticated financial reader to decipher. Media reporting on Treasury auction results is typically full of esoteric bond shorthand lingo and usually light on explanations. But don’t worry; this guide will break down how a smart real estate investor can understand and interpret Treasury auction results and fit them into the mortgage rate monitoring toolkit.

While Treasury actions, or the US government selling relatively simple debt instruments (into the most liquid market on the planet) should be pretty straightforward to follow, it’s full of financial lingo and concepts that are foreign to most observers. As is common in finance and real estate, these terms will be used quickly and casually, without straightforward explanations.
Let’s start with the difference between “Bills,” “Notes” and “Bonds” – US Treasuries (or debt issued by the US Government) fall into one of these three buckets based on how long the original duration or term of the debt is. US Treasury Bills or “T-Bills” have maturities less than one year, US Treasury “Notes” have maturities between 2 and 10 years, and include the most influential instruments for mortgage rates, the 5-Year Treasury and 10-Year Treasury. Finally, Treasury “Bonds” have maturities greater than 10 years but max out at 30 years. So technically, mortgage-backed securities, which are “Bonds” are compared most often against Treasury “Notes” when looking at the mortgage rate market. While most Treasury auctions look similar in structure, results and terminology, real estate investors looking for clues into movements on DSCR Loan rates should focus on 10-Year and 5-Year Note auctions particularly.
When the US Treasury is aiming to sell a round of Notes, 10-year Treasury Notes for example, they will typically use a process structured as a “Dutch Auction” where a certain number of notes with a par value of a certain amount will be sold to either “competitive” or “non-competitive” bids. Notes have what’s called a “yield” which is the rate of interest earned by the note-holder, which is calculated as the coupon rate or stated interest rate on the note divided by the value of the note. Typically, notes have a stated rate or coupon rate and an original value of “100” referred to as par. To illustrate:
A 10-Year Note has a par value of 100 and a coupon rate of 5%, meaning that at the original terms, a buyer would hypothetically fork over $100 to buy a note and receive 5% or $5 per year in annual interest payments while the debt is outstanding.
However, the market value of the note doesn’t necessarily equal $100, even at the time of issuance. For example, if the market rate of interest was actually 5.25% instead of 5%, the buyer might only pay $98.09 since paying full price for the bond would get only 5% in interest when the “market rate” or what they could get from another seller would be 5.25% on their $100 loan. So to buy a note that pays 5%, the buyer will offer less than the $100 or at a discount to make the price fair. While the math can get complex (see a bond calculator here), generally the bond’s yield would be the price of the bond divided by the interest paid and then discounted for present value. So in our example, the market yield would be 5.097%.
Bond Math:
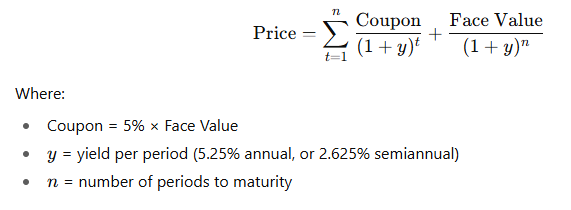
However, for these purposes, it’s just valuable to understand the relationship between bond par prices and coupons and their market prices and yields, and the sometimes counterintuitive aspect of yields and rates, where rising yields means lower bond prices rather than vice versa, so when yields are “up” that is a “bad thing” for rates, since it means bond prices are going down (which is the opposite up and down relationship to things like stocks, gold and other financial instruments, where “up” usually means “good”). This is why it can be a little confusing, especially when watching news clips on TV; some stations like Bloomberg uses the color “red” to denote rising yields and “green” when they are falling, but CNBC uses the opposite, somewhat confusingly showing the “good” green color to show bonds falling in value and yields rising.
In a “Dutch Auction,” the Treasury will sell Notes at a certain par price and par coupon, but what really matters is the yields that buyers will bid at, because despite what the actual interest rate is stated on the Note, what matters is how much buyers will pay for it, with the auction results showing the market rates or yields.

When the U.S. Treasury sells new bonds, investors can participate in two ways. Individuals who log in through TreasuryDirect can only place non-competitive bids, meaning agreeing to take whatever yield the auction clears at. Institutions, on the other hand, can place either non-competitive or competitive bids, where they specify the yield they want.
Large institutions can also trade ahead of time in what’s called the “when-issued” market. This is a kind of preview market where bonds trade on a “to be issued” basis. It sets expectations for the auction’s outcome and gives traders a benchmark for judging how strong or weak the actual results turn out to be.
Here’s how the auction process works. The Treasury first fills all the non-competitive bids. Whatever is left over is sold through a Dutch auction to competitive bidders. The government accepts bids starting with the lowest yields (cheapest financing for the Treasury) and works upward until the target amount is raised.
For example, imagine the Treasury needs to raise $100 million in 5-Year Notes with a 3.50% coupon. It first accepts $20 million in non-competitive bids, leaving $80 million for the competitive side. Suppose competitive bids come in as follows:
The Treasury will fill the lowest-yielding bids first. In this case, it would accept all bids up to 3.48% (a total of $75 million), then only $5 million of the $25 million bid at 3.52% to reach the full $100 million. The “competitive” bidders offering $20 million at 3.55% would not receive any notes, and four fifths of the $25 million 3.52% bid would not “get filled” either, with each bidder receiving a “pro-rata” portion of their bid. For example, if one of the bidders at 3.52% bid for a total of $2.5 million (10% of the bid at that level), they would receive $500,000, or 20% of their total bid; i.e. proportionally, not a “lottery” system.
At the end of the process, everyone who wins bonds receives the same yield, the highest accepted yield, known as the stop-out yield. In this example, that means that the competitive bidders at 3.42%, or the first $20 million to be filled of the competitive bids, still get 3.52% since it was the highest accepted yield.
The trading and pricing of these newly auctioned Treasury notes doesn’t just start on auction day, it typically starts about one week before the official auction starts. 5-Year Note auctions are typically announced in the second half of each month, auctioned a few business days later, and officially issued on the last day of the month while 10-Year Notes are typically announced in the first half of February, May, August, and November, with auctions typically held in the second week of those months.
What’s important is that trading starts among bidders when announced before the actual auction dates. The price during this pre-auction trading is referred to as the snap price or “when-issued yield” that plays a central role in how the market perceives the success (or lack thereof) of the auction results; which at the end of the day is what matters for overall yields, and by extension mortgage rates and what is important for real estate investors: DSCR Loan interest rates.

A key metric for judging the auctions is known as the bid-to-cover ratio (BTC) which is the simple ratio of total bids divided by notes sold. In this example, there were a total of $150 million in bids ($20 million in non-competitive bids and $130 million in competitive bids), so the $150 million in Bids divided by $100 million in Notes sold = 1.50x (or 150 ÷ 100). Generally, there aren’t “Wall Street Expectations” necessarily for auction bid-to-cover ratios, rather market watchers look for trends over time, specifically how the bid-to-cover ratio looks compared to prior auctions: if the BTC ratio is increasing (i.e. indicating more demand for notes), that is considered a good sign for the Treasury market, which can push yields and mortgage rates down. And the converse is true as well, if BTC ratios are decreasing, that indicates weakening demand for treasuries, pushing yields and rates up in the opposite direction.
Another key metric to watch in US Treasury Note auctions is what’s called the tail or the difference between the when-issued yield (pre auction) and the high yield (or yield that all the winning bidders receive at the auction). This measures the success of the auction itself, meaning when push came to shove, i.e. the actual market was tested, was the price of the notes better or worse than before? As usual, the interpretation of whether it’s “good” or “bad” is determinant on context, essentially a “positive tail” is “bad” meaning that the high yield is higher than expectations or pre-auction trading, while a “negative tail” is “good”, and shows more than expected demand at better prices. Generally, tails are only a basis point or two – but anything more, especially as a “positive tail” like in the 4+ bps range would be generally interpreted as “disastrous and…things are breaking in US treasuries.” As would a bid-to-cover ratio under 1.00x, or an auction that failed to find enough bidders (at any price) for a new issuance.
Of course, in the topsy turvy Fed-dominated US financial system of the 2020s, bad can be good and good can be bad, and “very bad” or “disastrous” could be “good” as well, as it could spur the Federal Reserve to do “quantitative easing” or essentially “print money” and require banks to buy the bonds, lowering rates and Treasury yields, at least as a band-aid. This would have the “double whammy” effect for real estate investors – as money printing and bond buying likely means lower mortgage rates and higher real estate (hard asset) values.

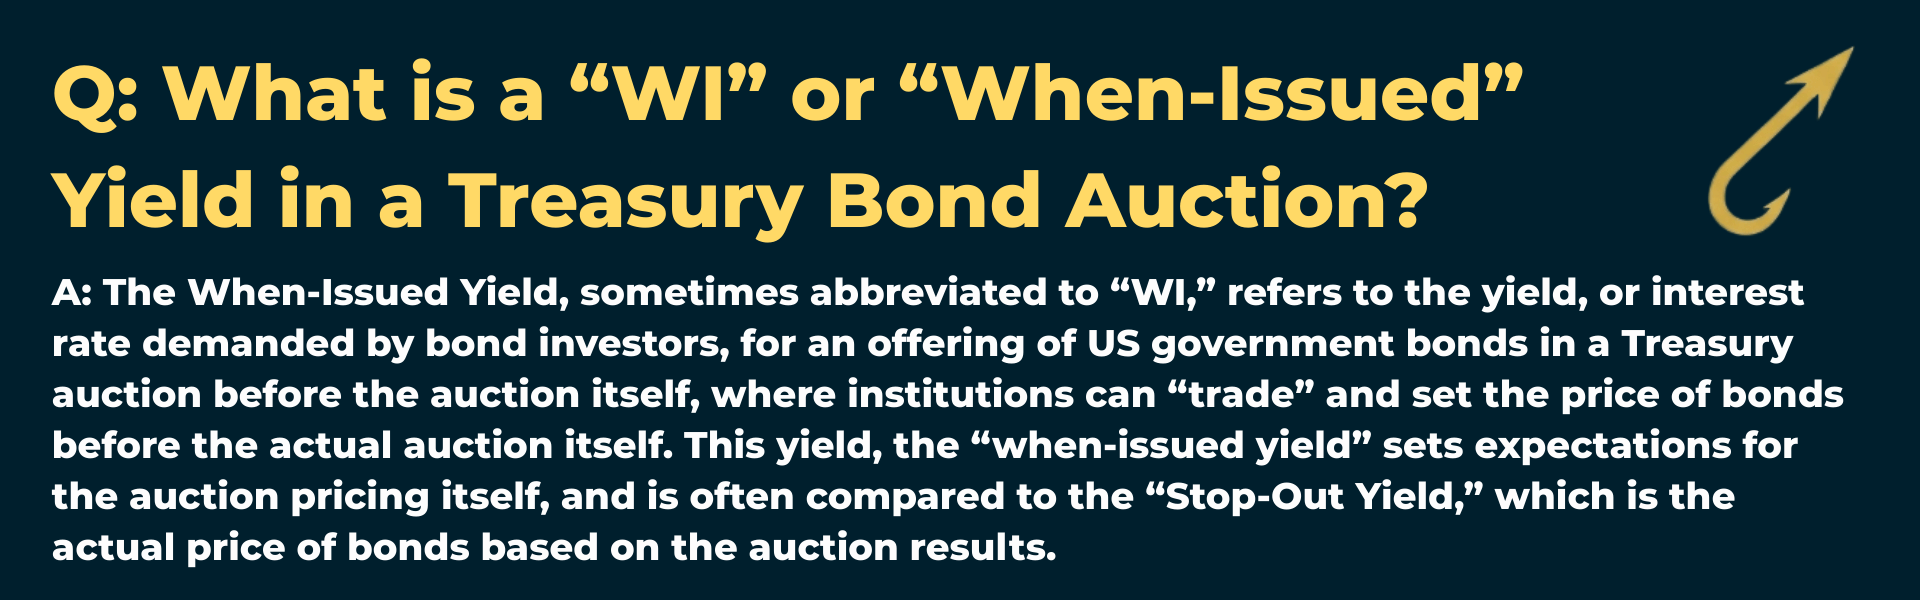
Q: What is a “WI” or “When-Issued” Yield in a Treasury Bond Auction?
A: The When-Issued Yield, sometimes abbreviated to “WI,” refers to the yield, or interest rate demanded by bond investors, for an offering of US government bonds in a Treasury auction before the auction itself, where institutions can “trade” and set the price of bonds before the actual auction itself. This yield, the “when-issued yield” sets expectations for the auction pricing itself, and is often compared to the “Stop-Out Yield,” which is the actual price of bonds based on the auction results.
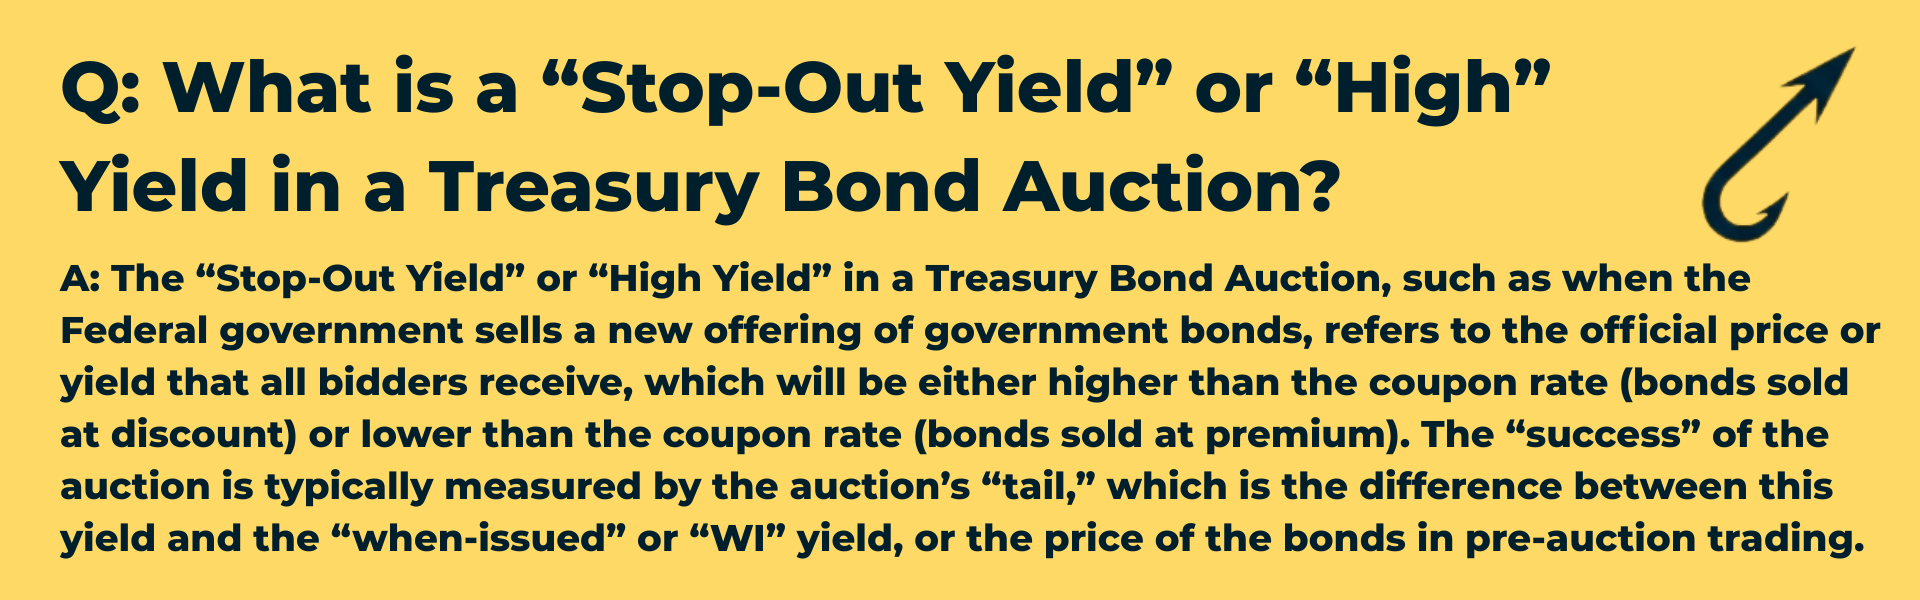
Q: What is a “Stop-Out Yield” or “High” Yield in a Treasury Bond Auction?
A: The “Stop-Out Yield” or “High Yield” in a Treasury Bond Auction, such as when the Federal government sells a new offering of government bonds, refers to the official price or yield that all bidders receive, which will be either higher than the coupon rate (bonds sold at discount) or lower than the coupon rate (bonds sold at premium). The “success” of the auction is typically measured by the auction’s “tail,” which is the difference between this yield and the “when-issued” or “WI” yield, or the price of the bonds in pre-auction trading.

Q: What is a “Tail” in a Treasury Bond Auction?
A: The Tail is the difference between the “When-Issued” yield and the “Stop-Out” or auction yield, showing the actual results of the auction when the notes actually went out to market. A positive tail is a “bad” auction result, indicating less than expected prices and demand for bonds, while a negative tail is a “good” auction result, indicating higher than expected demand and pricing for the bonds sold.
Up Next: DSCR Loan Rates Over Time & Future Outlook on DSCR Loan Rates
© 2026 Harpoon Capital, LLC. All Rights Reserved. WARNING: Unauthorized distribution, copying, or sharing of this guide is a violation of U.S. Federal Law and is punishable by civil penalties of up to $150,000 per violation. We aggressively enforce our intellectual property rights.