.png)

By Robin Simon, President, Harpoon Capital · About · LinkedIn · Author, The Book on DSCR Loans (Available on Amazon)

Indiana pairs some of the lowest entry prices in the Midwest with short-term rental revenue that grew in five of the six markets below, across a range that runs from a state capital and a manufacturing hub to college towns and a Lake Michigan lakeshore. Home prices run from about $150,000 in Terre Haute to about $327,000 in Bloomington (Redfin, 2026), and the “rent-to-price ratios” sit between roughly 0.45% and 0.62% a month on BiggerPockets, which is workable for a DSCR deal but not generous, so the underwriting matters. Investors buying here typically finance with Indiana DSCR loans, which are qualified primarily based on the property rather than the borrower's personal income.
This breakdown uses market data collected as of October 2026, the most current snapshot available heading into next year's buying season. If you're evaluating a purchase in the final months of 2026, keep in mind that your first full year of rental income, appreciation, or short-term rental revenue lands in 2027 regardless of when you close. A deal you underwrite today is already a 2027 investing decision, just one made with the freshest data available right now.
Indiana has no statewide short-term rental license, and according to Awning's 2026 Indiana guide rules are set locally, with county innkeeper's taxes that typically run 5% to 10% on top of the 7% state sales tax. Indianapolis is the one market here with a formal program: BNBCalc reports that every unit has needed an annual permit since January 1, 2025, with a $150 initial fee that state law caps and a 17% combined tax on stays under 30 days.
One pattern shows up in Redfin's search data, which tracks home searches rather than actual moves: Chicago buyers are the top inbound source for both Indianapolis (a net 368) and South Bend (898), while Michigan City's top inbound source is New York (320). Redfin's “Compete Scores” run from 84 in Fort Wayne (“very competitive”) down to 43 in Bloomington (“somewhat competitive”), so the state offers both bidding wars and negotiating room.
Below, we break down six Indiana markets worth watching, using current data from Redfin, BiggerPockets, and AirDNA.
Note: Home price appreciation and rent-growth figures below come from Redfin's median sale price data and BiggerPockets' Market Finder, which use different methodologies and can vary from one another. BiggerPockets' appreciation figures (7% to 10%) sit well above Redfin's recent price changes (from -5.1% to +8.0%), which suggests a longer window, so treat them as directional. BiggerPockets figures for Indianapolis, South Bend and Michigan City cover the wider Indianapolis–Carmel–Anderson, South Bend–Mishawaka (IN–MI) and Michigan City–La Porte metros. Redfin's Terre Haute data runs through June and its year-over-year price change is left out, because last year's sample was only 39 sales.
Steady growth under a new STR permit

Indianapolis is the state capital and its largest market, with the deepest tenant pool, the largest short-term rental field and a permit program that is only two years old.
BiggerPockets points to healthcare and technology, with Eli Lilly and Company and Indiana University Health among the major employers, and Redfin search data shows Chicago buyers looking at Indianapolis more than any other metro (a net 368), ahead of Los Angeles (177) and Seattle (90). However, 43.8% of homes saw price drops and days on market rose from 18 to 24, which points to buyers with some leverage, and First Street data on Redfin rates the flood risk as “moderate” (10% of properties). On the STR side, BNBCalc reports that Indianapolis requires an annual permit for each unit, that renewals are free, that the combined sales and Marion County innkeeper's tax is 17%, and that renting a unit more than 180 days also triggers landlord registration.
The Indianapolis market posts an AirDNA score of 92/100, with Revenue Growth (99) and Investability (90) leading, Seasonality (73) and Rental Demand (66) in the middle, and Regulation (63) the “soft spot.” Annual revenue per listing averages $34,434 (up 11.1% year-over-year), with an average daily rate of $182.60 (up 5.5%) and occupancy of 58% (up 5.3%). Total active listings sit at 4,397, down 0.2%, and the Downtown Indianapolis submarket (score 96, $36K a year at 58% occupancy) leads the area.
Financing note: Harpoon Capital offers industry leading DSCR Loans for properties in Indianapolis and all throughout the market area. Check out our full DSCR Loans Program here, or if you want a quote on what terms look like today, fill out this two-minute form!
Sources: Redfin Housing Market↗ · BiggerPockets Market Finder↗ · BNBCalc Indianapolis STR Guide↗ · AirDNA↗
Investor Takeaway: Indianapolis offers the deepest market in Indiana, with STR revenue up 11.1% on flat supply. Investors should generally budget for the permit and the 17% tax stack, underwrite the long-term rent first, and expect some negotiating room.
A perfect STR score and 74% occupancy
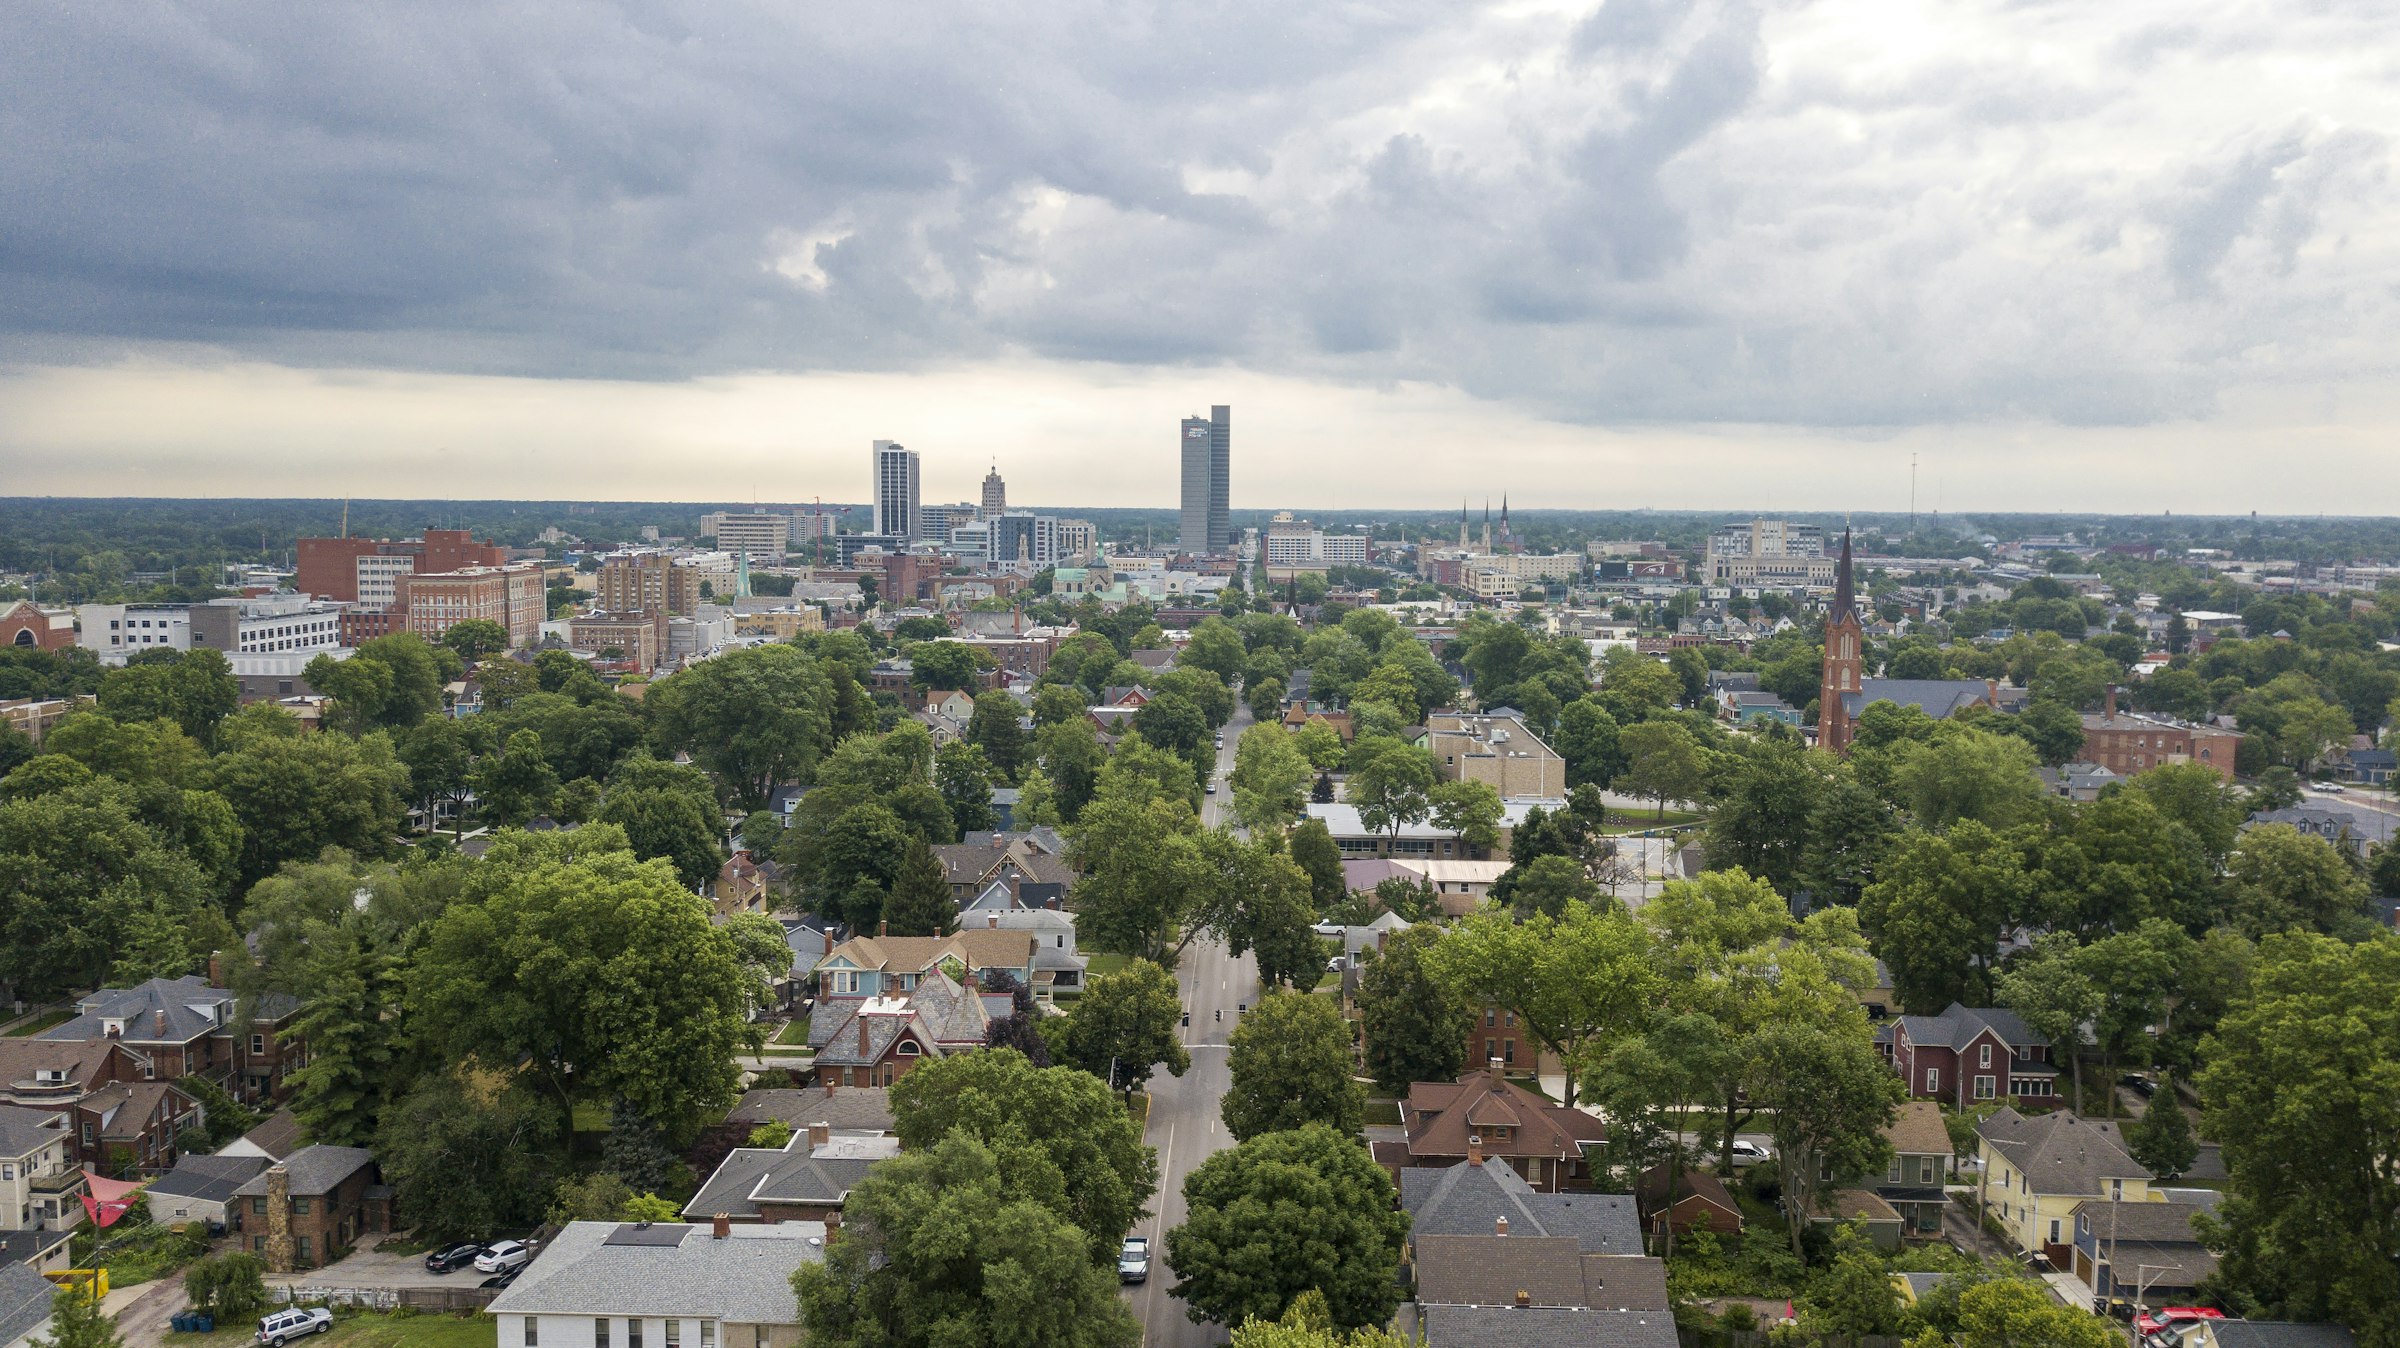
Fort Wayne is Indiana's second-largest city, with a manufacturing and healthcare economy, a very competitive buyer market and the strongest short-term rental numbers in the article!
BiggerPockets points to manufacturing and healthcare, with Parkview Health and General Motors among the major employers, and Redfin search data shows Indianapolis buyers looking at Fort Wayne more than any other metro (a net 74), ahead of Chicago (29). However, BiggerPockets' 10.36% appreciation sits against a flat Redfin median, and 53% of Fort Wayne buyers searched to leave the metro, with Miami and Washington the top destinations, so the demand story is mixed. First Street data on Redfin rates the flood risk as “major,” with 7% of properties exposed over the next 30 years. On the STR side, Awning reports that Fort Wayne has fewer formal restrictions than most cities.
The Fort Wayne submarket posts an AirDNA score of 100/100, with Investability (99) and Revenue Growth (98) at the top, Rental Demand (88) strong, and Regulation (57) the “soft spot.” Annual revenue per listing averages $27,832 (up 17.5% year-over-year), the fastest growth on the list, with an average daily rate of $114.23 (up 10.8%) and occupancy of 74% (up 10.3%), the highest on the list. Total active listings sit at 579, up 8.6%, and top listings such as Posh Pool Place ($105K a year at 76% occupancy) set the bar.
Financing note: Harpoon Capital offers industry leading DSCR Loans for properties in Fort Wayne and all throughout the market area. Check out our full DSCR Loans Program here, or if you want a quote on what terms look like today, fill out this two-minute form!
Sources: Redfin Housing Market↗ · BiggerPockets Market Finder↗ · Awning Indiana STR Guide↗ · AirDNA↗
Investor Takeaway: Fort Wayne offers the best STR momentum in Indiana on a 0.47% rent ratio, in a market where homes pend in about 14 days. Investors should generally expect to bid at list, underwrite on trailing twelve-month actuals, and watch the 8.6% jump in listings.
Buyer-friendly pricing, softening STR occupancy

Bloomington is home to Indiana University, and it is the one market here where the buyer has the upper hand, i.e. prices are falling, homes take 65 days to sell and STR occupancy is under 45%.
BiggerPockets points to Indiana University as a major economic driver, with healthcare and technology adding to a steady demand for student housing and rentals. However, a 5.1% price drop and a 96.9% sale-to-list ratio mean sellers are negotiating, which helps a buyer but also signals weaker appreciation, and First Street data on Redfin rates the flood risk as “moderate” (4% of properties). Redfin shows no migration data for Bloomington. On the STR side, Awning reports that Bloomington and Monroe County levy a local innkeeper's tax on top of the 7% state sales tax.
The Bloomington submarket posts an AirDNA score of 57/100, with Seasonality (81) leading, Investability (68) and Regulation (64) in the middle, and Revenue Growth (48) the “soft spot.” Annual revenue per listing averages $34,281 (down 0.8% year-over-year), with an average daily rate of $249.85 (up 4.7%) and occupancy of 43% (down 5.1%). Total active listings sit at 1,098, up 10.1%, so supply is growing while occupancy falls, and top listings such as Barn Burner ($288K a year) skew the average upward.
Financing note: Harpoon Capital offers industry leading DSCR Loans for properties in Bloomington and all throughout the market area. Check out our full DSCR Loans Program here, or if you want a quote on what terms look like today, fill out this two-minute form!
Sources: Redfin Housing Market↗ · BiggerPockets Market Finder↗ · Awning Indiana STR Guide↗ · AirDNA↗
Investor Takeaway: Bloomington offers negotiating room and university demand, with the weakest STR occupancy on the list. Investors should generally buy for the long-term rent, bargain hard, and treat the STR numbers as a “bonus” until occupancy stabilizes.
Thinking About One of These Markets?
Get a same-day DSCR Loan quote for a specific deal, or browse the full Harpoon Capital DSCR Loan Program to see rates, LTV, and qualification details before you keep reading.
Lakeshore revenue and negotiating room

Michigan City sits on the Lake Michigan shore in northwest Indiana – and it earns the highest revenue per listing in the article while still selling homes about 5% below list price.
BiggerPockets points to healthcare and manufacturing, with Franciscan Health Michigan City among the major employers, and Redfin search data shows New York buyers looking at Michigan City more than any other metro (a net 320), while local buyers most often search Milwaukee (1,544) and Cape Coral (1,133). However, a shrinking population and a sale-to-list ratio that fell 2.3 points suggest a buyer's market in the cheaper homes, i.e. room to negotiate, and First Street data on Redfin rates the flood risk as “minor” (8% of properties). No STR rules were confirmed for Michigan City.
The Michigan City submarket posts an AirDNA score of 72/100, with Investability (100) at the top, Revenue Growth (76) strong, Rental Demand (66) and Regulation (63) in the middle, and Seasonality (45) the “soft spot,” which is what a lakeshore market looks like. Annual revenue per listing averages $50,744 (up 3.0% year-over-year), with an average daily rate of $362.52 (down 1.6%) and occupancy of 54% (up 5.1%). Total active listings sit at 815, up 6.8%, and large-group properties such as The Lodge at Rush Lakes ($525K a year) show how much big houses can earn.
Financing note: Harpoon Capital offers industry leading DSCR Loans for properties in Michigan City and all throughout the market area. Check out our full DSCR Loans Program here, or if you want a quote on what terms look like today, fill out this two-minute form!
Sources: Redfin Housing Market↗ · BiggerPockets Market Finder↗ · AirDNA↗
Investor Takeaway: Michigan City offers the highest STR revenue in the article at low purchase prices, with a seasonal calendar and a falling rate. Investors should generally underwrite on trailing twelve-month actuals, model the off-season, and confirm the local rules before they buy.
The best rent ratio and the lowest prices

Terre Haute sits on the Wabash River in west-central Indiana – and it has the lowest prices and the highest rent-to-price ratio in the article, with a small but growing short-term rental field.
BiggerPockets points to healthcare and education, with Indiana State University and Union Health among the major employers. However, with a shrinking population and no Redfin migration data, the case rests on yield, not growth, and First Street data on Redfin rates the flood risk as “minor” but broad, with 19% of properties exposed over the next 30 years, so insurance quotes belong in the underwriting. No STR rules were confirmed for Terre Haute.
The Terre Haute submarket posts an AirDNA score of 88/100, with Investability (96) and Rental Demand (90) leading, Seasonality (76) and Regulation (63) in the middle, and Revenue Growth (51) the “soft spot.” Annual revenue per listing averages $27,231 (up 7.0% year-over-year), with an average daily rate of $133.67 (up 4.2%) and occupancy of 63% (up 3.5%). Total active listings sit at 192, up 10.3%, and group-lodge listings such as Deer Run Lodge ($220K a year at 70% occupancy) carry the top end.
Financing note: Harpoon Capital offers industry leading DSCR Loans for properties in Terre Haute and all throughout the market area. Check out our full DSCR Loans Program here, or if you want a quote on what terms look like today, fill out this two-minute form!
Sources: Redfin Housing Market↗ · BiggerPockets Market Finder↗ · AirDNA↗
Investor Takeaway: Terre Haute offers the best yield and the lowest entry price in Indiana, with flat population and meaningful flood exposure. Investors should generally buy for the rent-to-price ratio, check the flood map for each address, and treat the STR side as a small-sample “bonus.”
Notre Dame weekends and a rate-led market

South Bend is home to the University of Notre Dame, and its short-term rental market is rate-led, with high nightly prices on football weekends and occupancy that has slipped.
BiggerPockets points to the University of Notre Dame as a major economic driver, with Beacon Health System among the major employers, and Redfin search data shows Chicago buyers looking at South Bend more than any other metro (a net 898), ahead of Indianapolis (78) and Detroit (45). However, 45% of South Bend buyers searched to leave the metro, with Cape Coral the top destination, and First Street data on Redfin rates the flood risk as “minor” (10% of properties). On the STR side, Awning reports that demand spikes around major sporting events and graduation season, and no STR rules were confirmed for South Bend.
The South Bend market posts an AirDNA score of 85/100, with Investability (97) and Revenue Growth (97) leading, Seasonality (72) in good shape, Rental Demand (56) and Regulation (53) the “soft spots.” Annual revenue per listing averages $39,106 (up 4.7% year-over-year), with an average daily rate of $288.41 (up 11.8%) and occupancy of 45% (down 7.3%), so the revenue gain is “rate-led.” Total active listings sit at 1,604, up 7.4%, and the Elkhart (score 94, $33K) and South Bend (score 86, $34K at a $314 rate) submarkets lead the area.
Financing note: South Bend deals often qualify on TTM actuals or STR revenue projections given the event-driven revenue base, and Harpoon Capital offers industry leading DSCR Loans for properties throughout the market area. Check out our full DSCR Loans Program here, or if you want a quote on what terms look like today, fill out this two-minute form!
Sources: Redfin Housing Market↗ · BiggerPockets Market Finder↗ · Awning Indiana STR Guide↗ · AirDNA↗
Investor Takeaway: South Bend offers event-driven STR revenue at low purchase prices, in a fast-moving sales market with falling occupancy. Investors should generally underwrite on trailing twelve-month actuals, model the football calendar, and treat the 11.8% rate gain as only as durable as the demand behind it.
| MARKET | AIRDNA SCORE |
ANNUAL REVENUE |
AVG. DAILY RATE |
OCCUPANCY | YOY LISTING GROWTH |
|---|---|---|---|---|---|
| Fort Wayne | 100 | $27,832 (+17.5%) |
$114.23 (+10.8%) |
74% (+10.3%) | +8.6% (579 listings) |
| Indianapolis | 92 | $34,434 (+11.1%) |
$182.60 (+5.5%) |
58% (+5.3%) | -0.2% (4,397 listings) |
| Terre Haute | 88 | $27,231 (+7.0%) |
$133.67 (+4.2%) |
63% (+3.5%) | +10.3% (192 listings) |
| South Bend | 85 | $39,106 (+4.7%) |
$288.41 (+11.8%) |
45% (-7.3%) | +7.4% (1,604 listings) |
| Michigan City | 72 | $50,744 (+3.0%) |
$362.52 (-1.6%) |
54% (+5.1%) | +6.8% (815 listings) |
| Bloomington | 57 | $34,281 (-0.8%) |
$249.85 (+4.7%) |
43% (-5.1%) | +10.1% (1,098 listings) |
Source: AirDNA, current as of 2026. Scores and figures reflect each market or submarket as defined by AirDNA and may not correspond 1:1 with city or county boundaries. As of October 2026
A few patterns stand out. Fort Wayne and Indianapolis are the two markets where revenue, rate and occupancy all rose, with Indianapolis doing it on flat supply and Fort Wayne on supply up 8.6%. South Bend and Bloomington show the opposite shape, with rates rising while occupancy fell by more than 5%, which usually means that hosts are holding price and losing nights. Michigan City earns the most per listing ($50,744) with a falling rate, and Terre Haute is the only low-priced market where listings grew about 10% and occupancy still rose.
Indiana's real estate landscape offers a strategy for nearly every type of investor:
Market-level data is a starting point, not a substitute for underwriting the specific property, neighborhood, and rental strategy in front of you. Indiana leaves most short-term rental rules to its cities and counties, and Indianapolis now requires a permit, so confirm what's required at your specific address before you close, and check flood maps in Terre Haute, Fort Wayne and Indianapolis.
If you are ready to invest in one of these markets, start with our Indiana DSCR loans page.
Sources: Redfin housing market data, BiggerPockets Market Finder, AirDNA market and submarket data (airdna.co), BNBCalc Indianapolis STR guide and Awning Indiana STR regulations. Data collected as of October 2026, ahead of the 2027 investing season.
No. Indiana has no statewide short-term rental license, so rules are set locally. According to BNBCalc, Indianapolis has required an annual permit for each unit since January 1, 2025, with a $150 initial fee that state law caps and no renewal fee. Taxes apply everywhere: Awning reports a 7% state sales tax plus a county innkeeper's tax that typically runs 5% to 10%, and BNBCalc puts Marion County's at 10%.
No. Out-of-state and first-time investors can buy investment property in Indiana without any license. A DSCR loan qualifies you primarily based on the property itself rather than your personal income or professional credentials, which is part of why it's such a common financing tool for out-of-state buyers.
A DSCR (Debt Service Coverage Ratio) loan qualifies a property primarily based on the property (its value, value and location) relative to its mortgage payment, rather than the borrower's personal income or tax returns. If the property's projected or actual rent covers the mortgage payment (a DSCR of 1.00x or higher), it's generally easier to qualify, and Harpoon Capital also offers options for deals below 1.00x.
BNBCalc reports that crossing 180 rented days makes you a landlord in the city's eyes as well as a short-term rental operator, which means a second registration. Confirm the current threshold and process with the Department of Business and Neighborhood Services before you plan around it.
Harpoon Capital's DSCR loan program allows as little as 15% down on qualifying purchases, up to 85% LTV, with cash-out refinances available up to 80% LTV. Exact terms depend on the property, credit profile, and DSCR ratio. Fill out our DSCR Loan Application to see specific numbers for your deal.
Ready to Run the Numbers on an Indiana Deal?
Whether you're eyeing Fort Wayne's momentum or lakeshore stays in Michigan City, get a same-day rate and terms with our two-minute DSCR quote form, or explore the full Indiana DSCR Loans Program to see how we qualify the property, not just the borrower.
This article is for informational purposes only and does not constitute investment, legal, or financial advice. Harpoon Capital encourages investors to conduct independent due diligence before making any real estate investment decision.