.png)


By Robin Simon, President, Harpoon Capital · About · LinkedIn · Author, The Book on DSCR Loans (Available on Amazon)

The best Nebraska markets for real estate investors in 2027 offer entry points from about $240,000 in Fremont and strong short-term rental potential, led by $29,162 in average annual STR revenue in Omaha and AirDNA scores of 98 in Norfolk and 97 in Fremont. Nebraska is one of the steadiest housing markets in the country, and its six markets below run along the Platte River and Interstate 80, from Omaha and the state capital in Lincoln to the college town of Kearney, Fremont on Omaha's western edge, the northeast hub of Norfolk and Grand Island, home to the Nebraska State Fair. Median sale prices run up to about $354,000 in Kearney (Redfin, 2026), and BiggerPockets puts rent-to-price ratios at 0.44% a month in the Omaha metro, 0.43% in Grand Island and 0.40% in Lincoln, with rents between about $930 and $1,200. Investors buying here typically finance with Nebraska DSCR loans, which are qualified primarily based on the property rather than the borrower's personal income, and Nebraska's modest prices give the “DSCR Ratio” more room than in most states.
This breakdown uses market data collected as of October 2026, the most current snapshot available heading into next year's buying season. If you're evaluating a purchase in the final months of 2026, keep in mind that your first full year of rental income, appreciation, or short-term rental revenue lands in 2027 regardless of when you close. A deal you underwrite today is already a 2027 investing decision, just one made with the freshest data available right now.
Nebraska has no statewide short-term rental license, but hosts need a state Lodging Tax Permit, and stays carry the 5.5% state sales tax plus any local sales tax, a 1% state lodging tax, a 4% county lodging tax in all six of these markets' counties and a city occupation tax in Omaha (5.5%), Lincoln (4%), Norfolk (4%) and Kearney (2%), and Airbnb collects the state and county taxes and Omaha's city tax, but not Lincoln's (BNBCalc). Additionally, state law (LB57, 2019) bars cities from banning short-term rentals outright, although they can still license and regulate them, and Lincoln, Kearney and Norfolk all require an annual STR license or permit. In practice, i.e. for an investor buying a nightly rental, the local license and tax setup typically matters more than any restriction on where an STR can operate.
Nebraska's larger markets are also competitive. Redfin's “Compete Scores” run from 86 in Kearney and 84 in Omaha (both “very competitive”) down to 49 in Norfolk, and homes in Kearney and Omaha are selling in a median of 12 and 16 days. Redfin search data shows Kansas City and Chicago buyers looking at Omaha more than any other metro, while Omaha's own buyers most often searched toward San Francisco and Des Moines.
Below, we break down six Nebraska markets worth watching, using current data from Zillow, Redfin, BiggerPockets, and AirDNA.
Note: Home price appreciation and rent-growth figures below come from Redfin's median sale price data, Zillow's Home Value Index and BiggerPockets' Market Finder, which use different methodologies and can vary from one another, so treat them as directional. Omaha's BiggerPockets figures cover the Omaha-Council Bluffs metro, and Kearney, Fremont and Norfolk do not have BiggerPockets pages of their own, so Zillow's figures are used for them. Redfin's Norfolk price per square foot looked unreliable at the time of writing and is left out. Redfin's migration table for Fremont repeats Omaha's and is left out. AirDNA's Omaha and Lincoln figures cover their full markets, and Kearney, Fremont, Norfolk and Grand Island are submarkets of its Nebraska Area market.
Big-market depth at a Midwest price

Omaha is Nebraska's largest city, home to Union Pacific, Berkshire Hathaway, Mutual of Omaha and Offutt Air Force Base, with the deepest sales and STR markets in the state. It is the market on this list where homes sell quickly and an investor has the most inventory to choose from.
The case for Omaha rests on a diverse, headquarters-heavy job base in rail, finance, insurance, healthcare and the military, with Berkshire Hathaway and the University of Nebraska Medical Center among the major employers BiggerPockets names, and Redfin search data (April to June 2026) shows Kansas City (a net 63), Chicago (54) and Seattle (24) buyers looking at Omaha most, although 34% of local buyers searched to leave, led by San Francisco and Des Moines. The College World Series also fills the city every June. First Street data on Redfin rates the flood risk as “minor” (3% of properties). On the STR side, Omaha had no citywide STR registration as of mid-2026 (a registration ordinance was proposed in July 2026), but stays carry about 17.5% in combined taxes (5.5% state and 1.5% city sales tax, the 1% state lodging tax, Douglas County's 4% lodging tax and the city's 5.5% hotel occupation tax), all of which Airbnb collects on Omaha bookings (BNBCalc).
The Omaha market posts an AirDNA score of 67/100, with Investability (79) and Rental Demand (79) leading, Revenue Growth (67) and Regulation (63) next, and Seasonality (59) the “soft spot.” Annual revenue per listing averages $29,162 (up 1.4% year-over-year), the highest in the article, with an average daily rate of $154.48 (up 0.2%) and occupancy of 60% (up 2.1%). Total active listings sit at 1,557, down 3.4%, the deepest STR market in the article, and the Downtown Omaha (score 81, $26K a year at 54% occupancy), Kountze Place (80) and Bellevue (78, $31K at 58%) submarkets lead the area.
Financing note: Harpoon Capital offers industry leading DSCR Loans for properties in Omaha and all throughout the market area. Check out our full DSCR Loans Program here, or if you want a quote on what terms look like today, fill out this two-minute form!
Sources: Redfin Housing Market↗ · BiggerPockets Market Finder↗ · BNBCalc Omaha STR Guide↗ · AirDNA Market Data↗
Investor Takeaway: Omaha offers the deepest market and the best rent ratio in Nebraska, a diverse job base and fast-moving sales, with no citywide STR registration yet. Investors should generally be ready to offer at or near list within days, buy for the long-term rent, and budget for the full 17.5% tax load if nightly stays are part of the plan.
Capitol, campus and Cornhusker crowds

Lincoln is Nebraska's capital and home to the University of Nebraska-Lincoln, with state government, the university and healthcare behind a steady rental base, and an STR market built around Husker football weekends. It is the market on this list with the most balanced mix of long-term and short-term demand.
BiggerPockets points to government, healthcare and education, with the University of Nebraska-Lincoln and Bryan Health among the major employers, and Redfin search data (April to June 2026) shows Dallas (a net 15), Seattle (11) and Chicago (11) buyers looking at Lincoln most. However, First Street data on Redfin rates the flood risk as “major” (6% of properties), so flood insurance should be priced early. On the STR side, Lincoln has required an STR license since September 20, 2021 (Ordinance 21075), at $250 per unit per year, with occupancy capped at two guests per sleeping area and 12 in all (BNBCalc). Stays carry 1.75% in city sales tax and a 4% city occupation tax on top of the state and county taxes, and Airbnb does not collect the occupation tax, so hosts remit it to the city.
The Lincoln market posts an AirDNA score of 92/100, with Rental Demand (93), Revenue Growth (88) and Investability (81) leading, Seasonality (72) next, and Regulation (57) the “soft spot.” Annual revenue per listing averages $29,038 (up 5.9% year-over-year), with an average daily rate of $151.92 (up 3.2%) and occupancy of 58% (up 2.1%). Total active listings sit at 495, up 3.8%, and large group homes carry the top end, such as an eight-bedroom group reunion home ($118K a year).
Financing note: Harpoon Capital offers industry leading DSCR Loans for properties in Lincoln and all throughout the market area. Check out our full DSCR Loans Program here, or if you want a quote on what terms look like today, fill out this two-minute form!
Sources: Redfin Housing Market↗ · BiggerPockets Market Finder↗ · BNBCalc Nebraska STR Guide↗ · AirDNA Market Data↗
Investor Takeaway: Lincoln offers a 0.40% rent ratio, steady population growth and a high-scoring STR market, on a stable government and university base. Investors should generally buy for the long-term rent near campus or downtown, license any STR with the city each year and remit the city occupation tax, and check the flood map for each address.
College-town climb on the Great Platte River Road
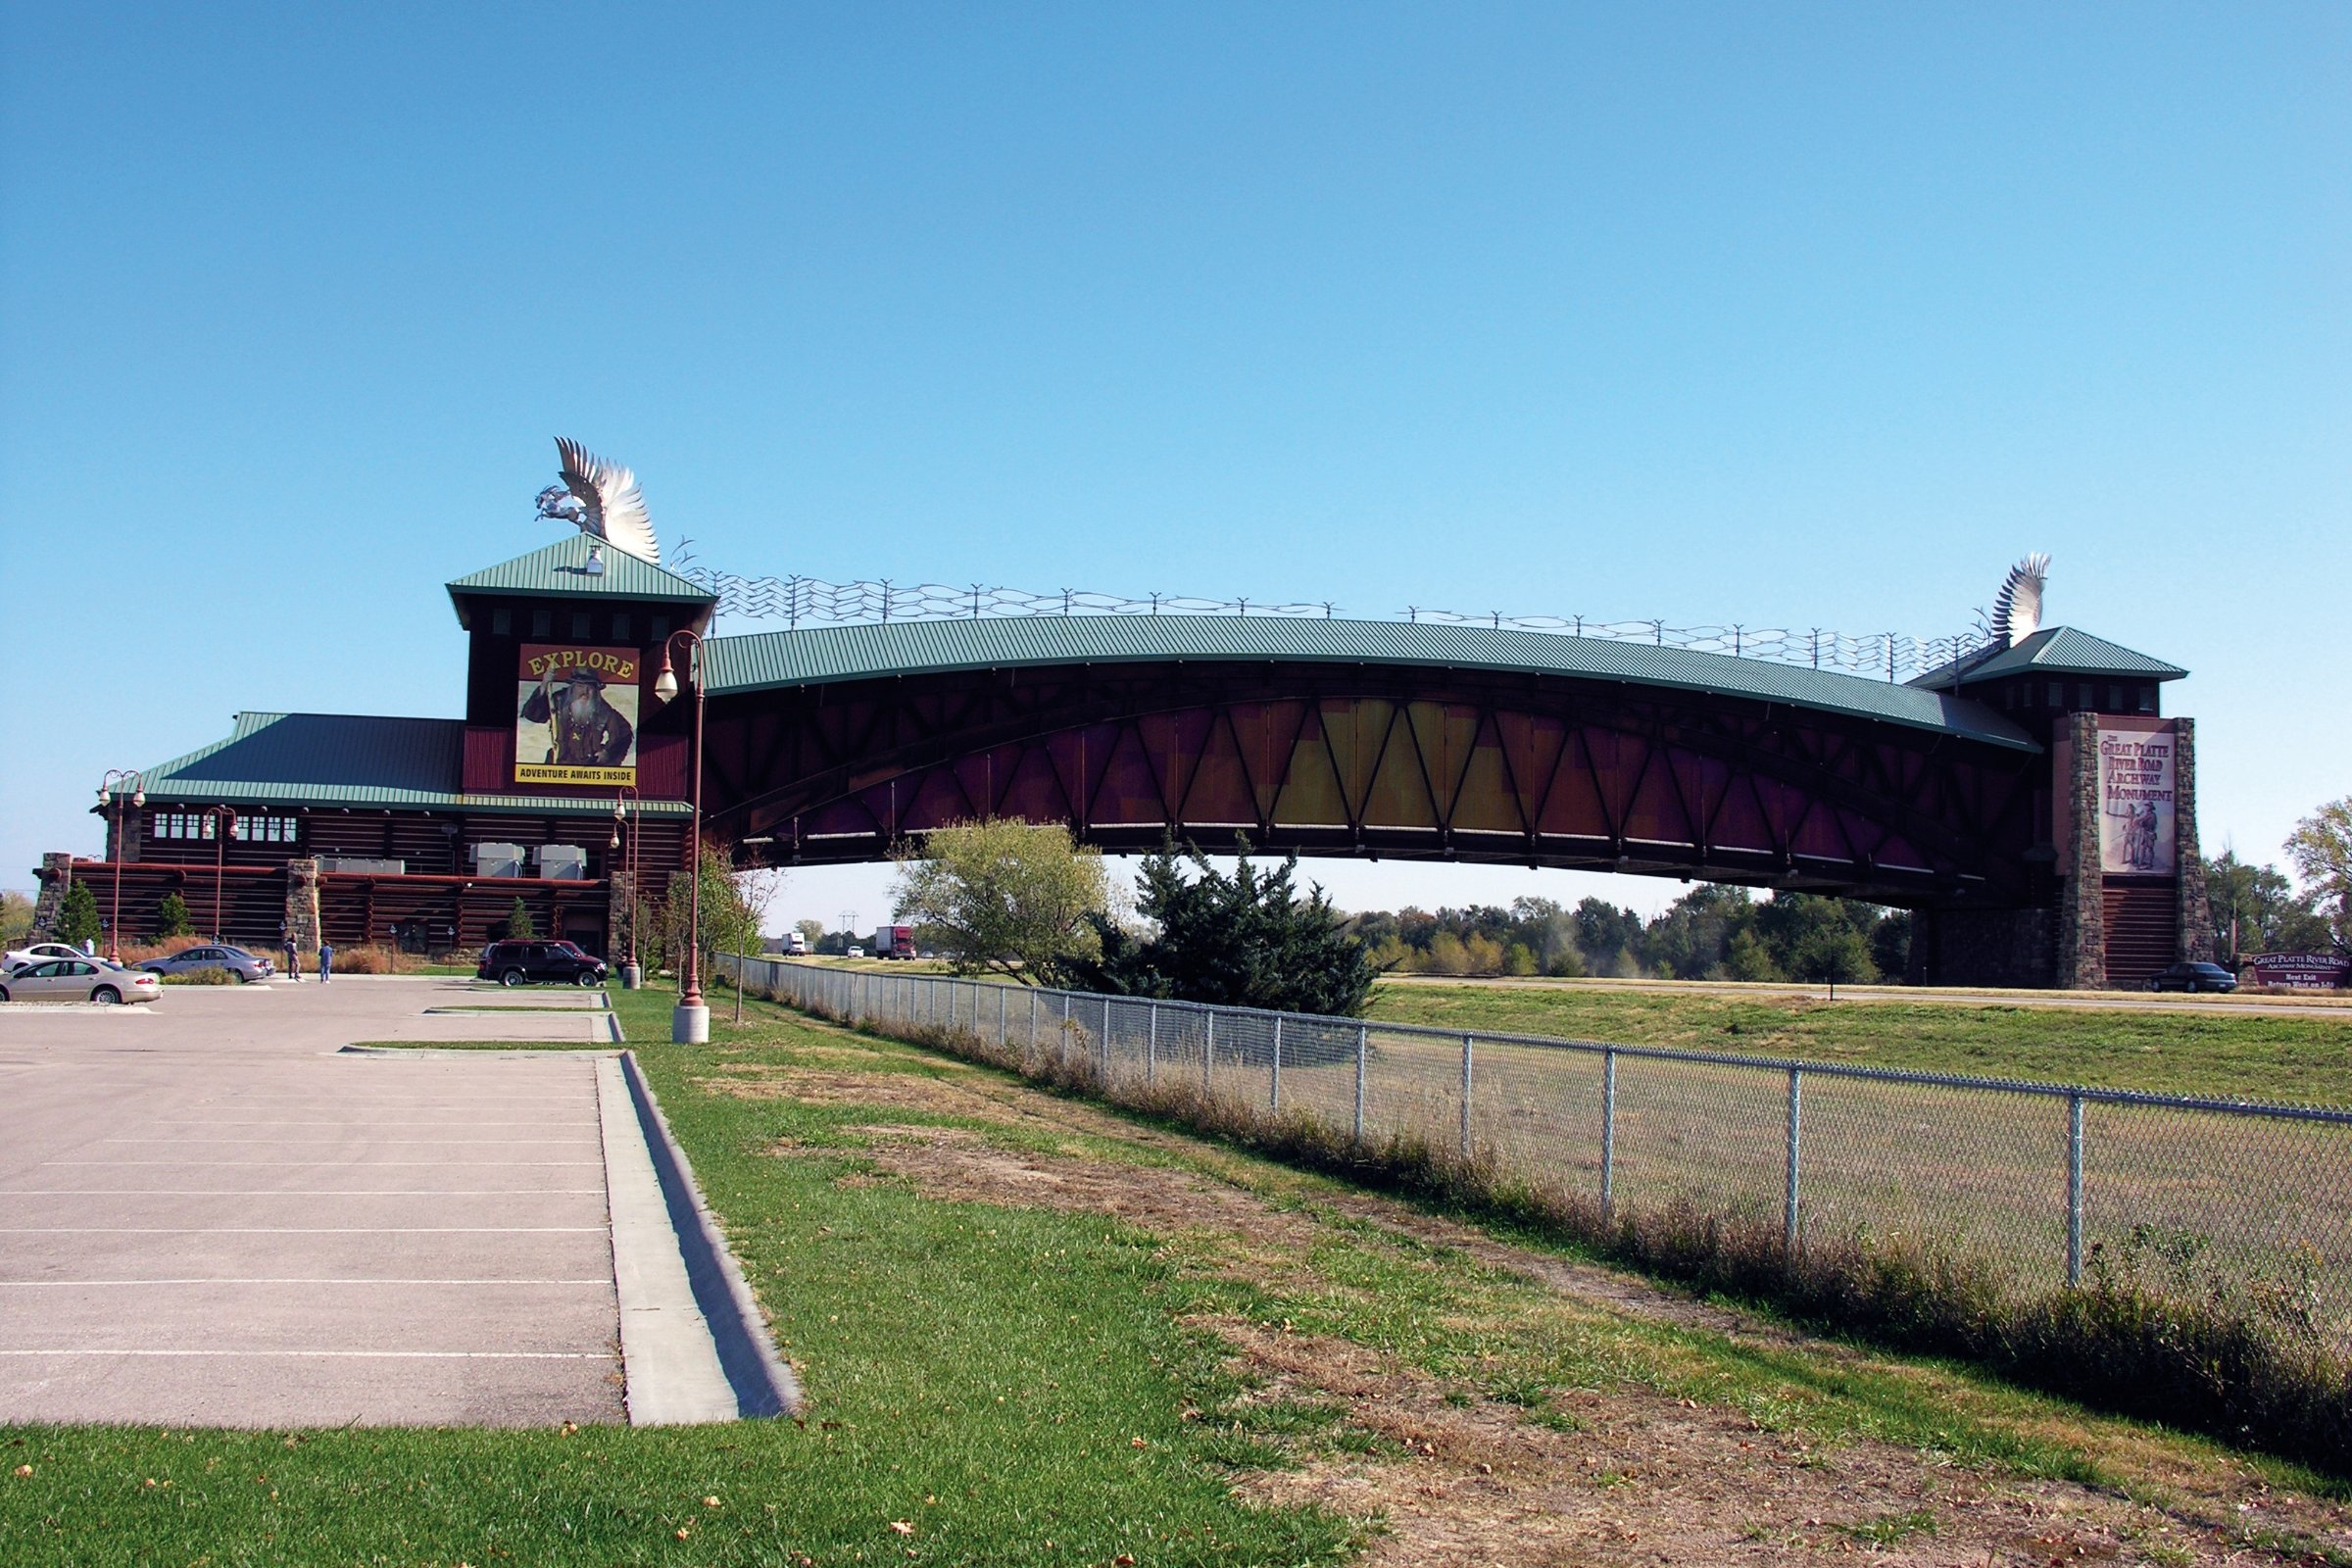
Kearney sits on Interstate 80 in central Nebraska, home to the University of Nebraska at Kearney and the Great Platte River Road Archway, with the fastest price growth and the most competitive sales market on this list. Each spring, the sandhill crane migration along the nearby Platte River adds a seasonal wave of visitors.
The case for Kearney rests on the university, a regional medical and retail hub and its spot on I-80, and on rents that are up 6.2% over the year. However, homes are selling so quickly that investors should generally be ready to offer at or above list. First Street data on Redfin rates the flood risk as “minor” (7% of properties). On the STR side, the City of Kearney requires an annual STR permit ($100 the first year, $25 to renew, expiring each December), a local contact who can reach the property within 30 minutes, smoke and carbon monoxide alarms, and occupancy of no more than two people per sleeping area, and stays carry the city's 2% hotel occupation tax and 1.5% city sales tax plus Buffalo County's 4% lodging tax.
The Kearney submarket posts an AirDNA score of 73/100, with Revenue Growth (84), Seasonality (76) and Rental Demand (75) leading, Investability (65) next, and Regulation (51) the “soft spot.” Annual revenue per listing averages $24,252 (down 5.9% year-over-year), with an average daily rate of $144.77 (up 7.8%) and occupancy of 52% (down 14.2%). Total active listings sit at 114, up 8.6%, and larger homes carry the top end, such as a four-bedroom home with a hot tub ($60K a year at 62% occupancy).
Financing note: Harpoon Capital offers industry leading DSCR Loans for properties in Kearney and all throughout the market area. Check out our full DSCR Loans Program here, or if you want a quote on what terms look like today, fill out this two-minute form!
Sources: Zillow Home Value Index↗ · Redfin Housing Market↗ · City of Kearney STR Guide↗ · AirDNA Market Data↗
Investor Takeaway: Kearney offers the fastest price and rent growth in Nebraska, on a university and regional-hub job base. Investors should generally move quickly on well-priced listings, buy for the long-term rent, and permit any STR with the city before listing it.
Thinking About One of These Markets?
Get a same-day DSCR Loan quote for a specific deal, or browse the full Harpoon Capital DSCR Loan Program to see rates, LTV, and qualification details before you keep reading.
Low prices at the edge of the Omaha metro
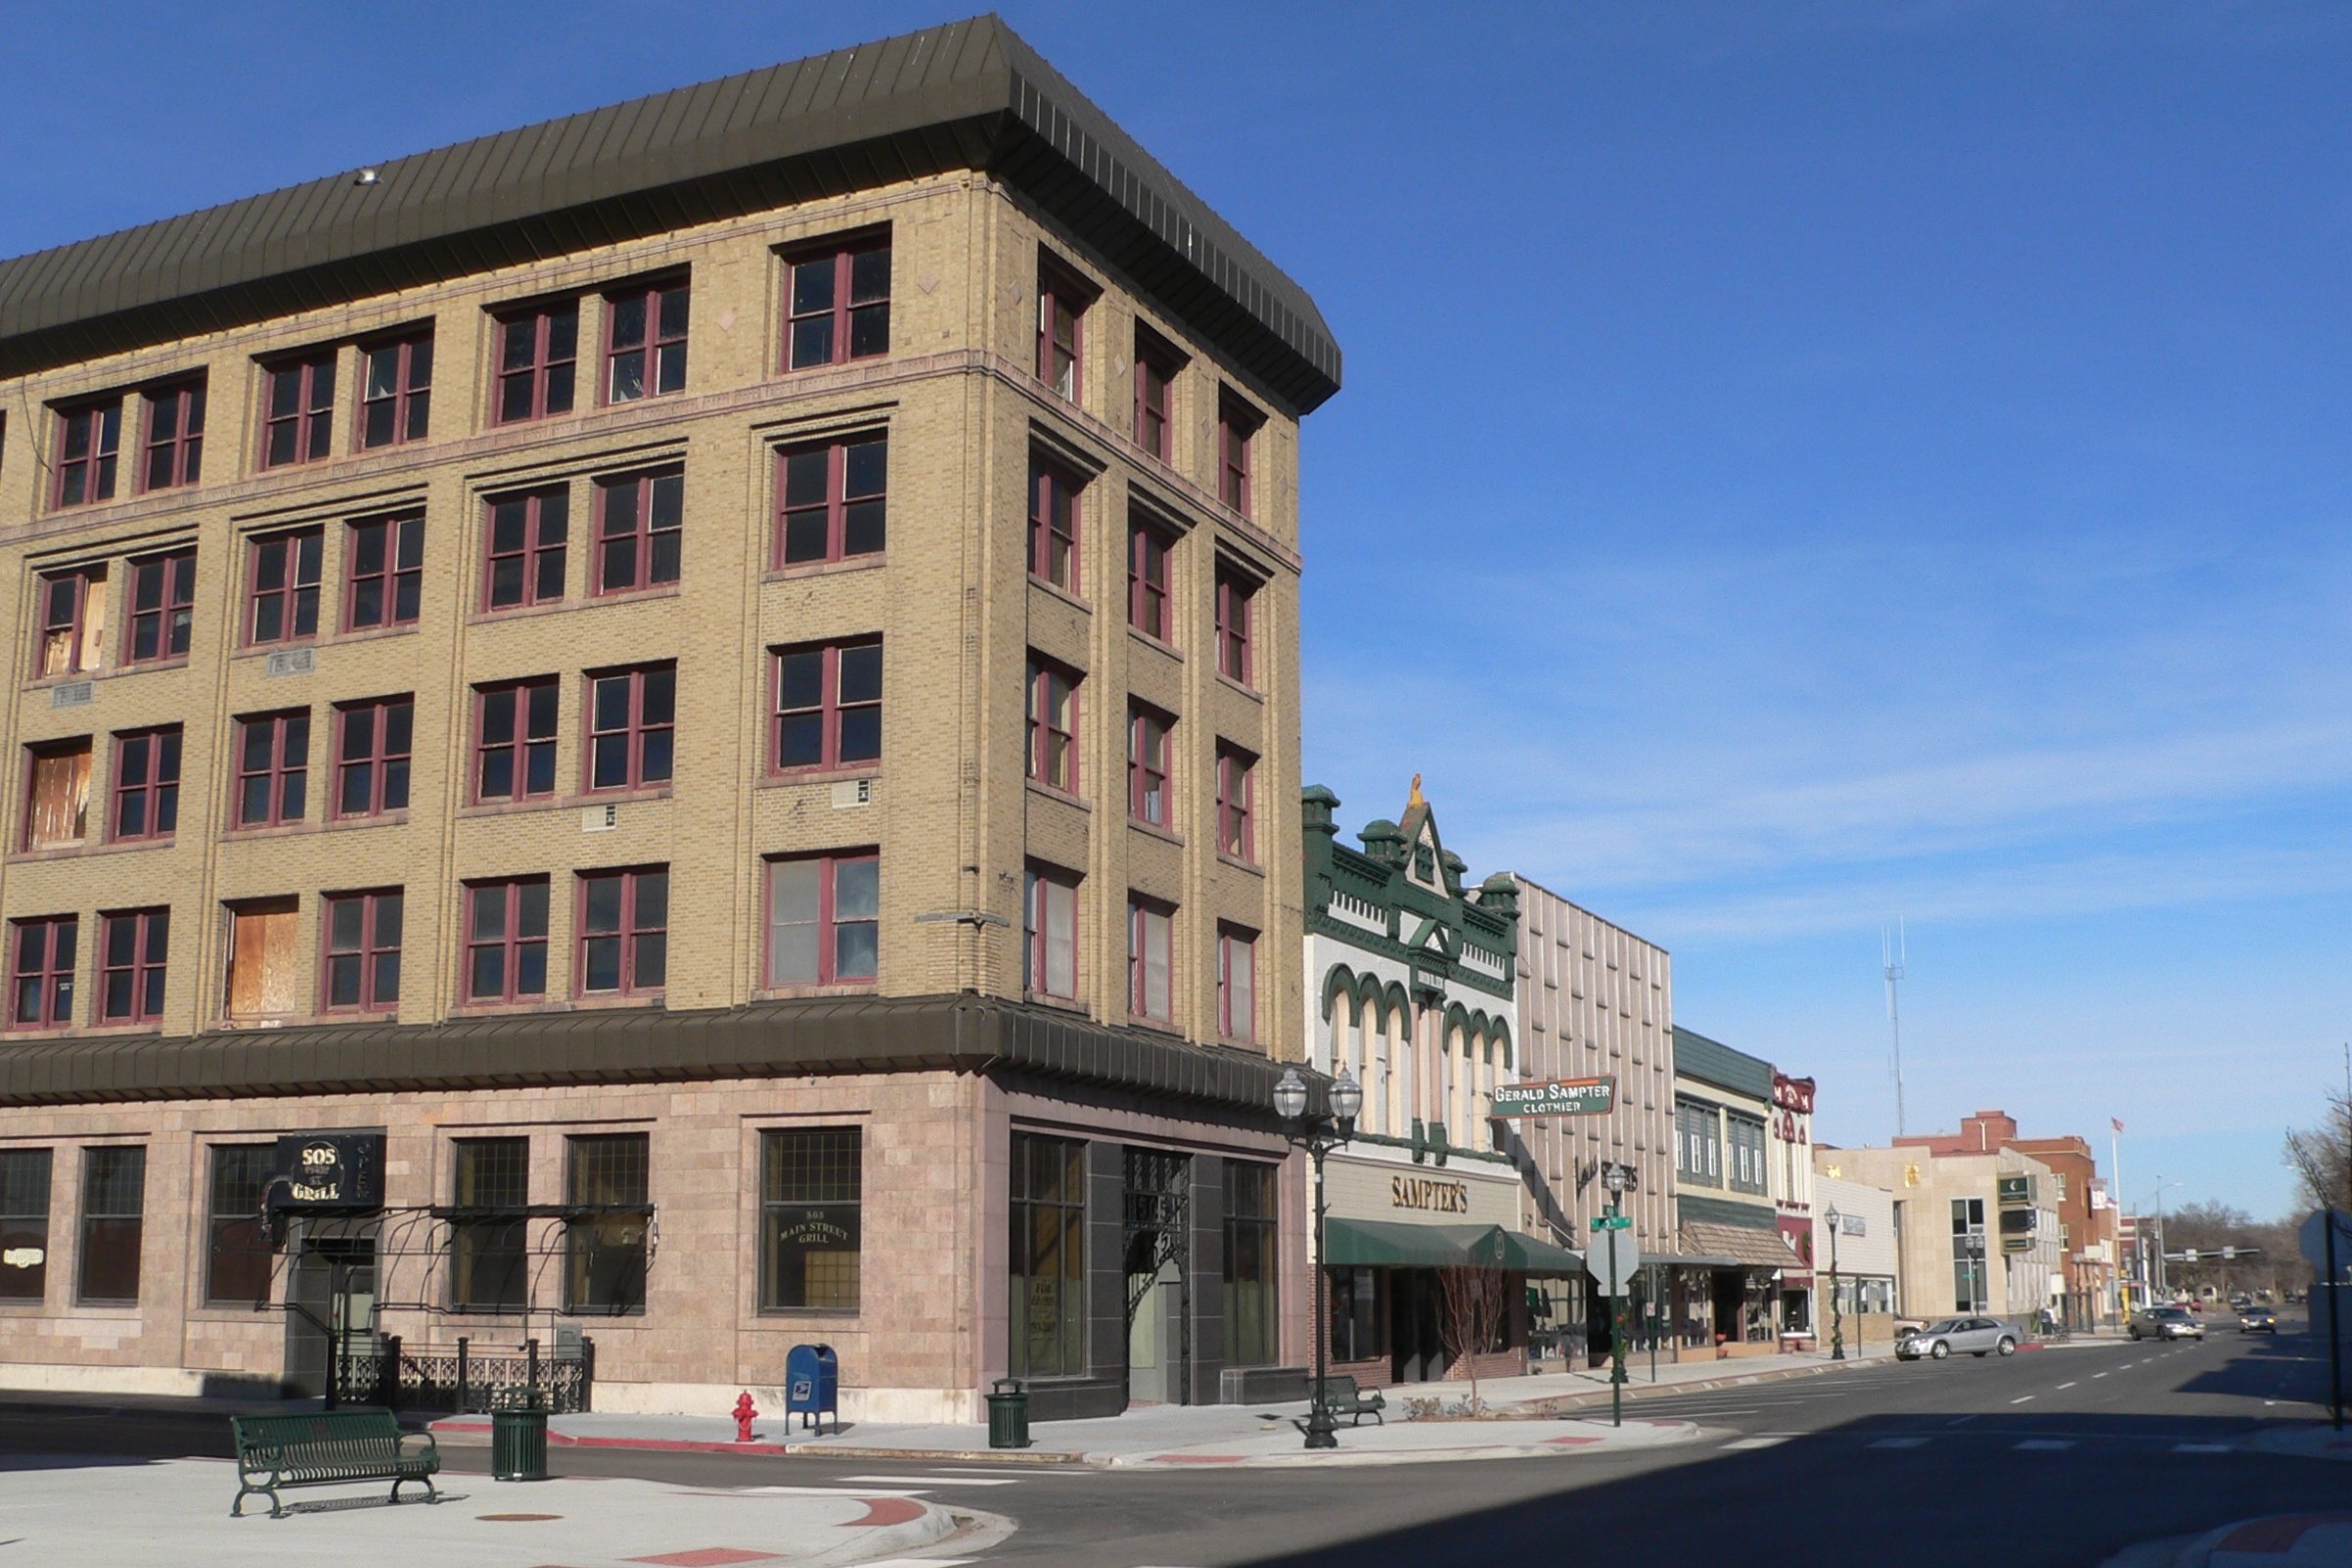
Fremont sits about 35 miles northwest of downtown Omaha, within the Omaha metro, with food processing and manufacturing employers, Midland University and the Fremont Lakes nearby, and the lowest prices on this list. It is the value market in the article, with an STR market that is small but growing fast.
The case for Fremont rests on Omaha-area jobs within commuting distance, local manufacturing and food processing, and prices well below Omaha's. However, more than a third of listings saw price cuts, and First Street data on Redfin rates the flood risk as “moderate,” with 26% of properties exposed, the highest on the list, so flood insurance should be priced before making an offer. On the STR side, stays carry the 5.5% state and 1.5% city sales taxes, the 1% state lodging tax and Dodge County's 4% lodging tax, and investors should confirm licensing and zoning rules with the city before buying (BNBCalc).
The Fremont submarket posts an AirDNA score of 97/100, with Revenue Growth (100), Rental Demand (93) and Investability (84) leading, Seasonality (66) next, and Regulation (62) the “soft spot.” Annual revenue per listing averages $26,774 (up 24.2% year-over-year), with an average daily rate of $138.89 (up 1.8%) and occupancy of 61% (up 26.9%), but on only 19 active listings (up 11.8%), so a few properties can move these figures a great deal. Lake cabins carry the top end, such as a pet-friendly cabin on the lake ($41K a year at 52% occupancy).
Financing note: Harpoon Capital offers industry leading DSCR Loans for properties in Fremont and all throughout the market area. Check out our full DSCR Loans Program here, or if you want a quote on what terms look like today, fill out this two-minute form!
Sources: Zillow Home Value Index↗ · Redfin Housing Market↗ · BNBCalc Nebraska STR Guide↗ · AirDNA Market Data↗
Investor Takeaway: Fremont offers the lowest prices in the article and room to negotiate, within reach of Omaha's job market. Investors should generally use the high share of price cuts to negotiate, check the flood map for every address, and treat the small STR market as upside rather than the base case.
Northeast Nebraska's hub and a near-perfect STR score

Norfolk is the regional hub for northeast Nebraska, with healthcare, manufacturing including a Nucor steel mill, agriculture and Northeast Community College behind its job base, and the highest STR score on this list. It is a small, steady market where prices sit below Lincoln's and Kearney's.
The case for Norfolk rests on its role as the shopping, medical and job center for a wide rural area, which keeps both rental and visitor demand steady, with business travelers, families visiting students and hospital patients filling short stays. However, its Compete Score of 49 points to a slower sales market than Omaha's or Kearney's, so buyers typically have more room to negotiate. On the STR side, Norfolk requires an STR license ($150 a year), with an inspection (including smoke and carbon monoxide detectors) before approval, occupancy of two guests per sleeping area and 12 in all, and a local contact who can reach the property within 45 minutes. Stays carry 2% in city sales tax, a 4% city occupation tax and Madison County's 4% lodging tax on top of the state taxes.
The Norfolk submarket posts an AirDNA score of 98/100, the highest in the article, with Revenue Growth (97), Rental Demand (95), Seasonality (90) and Investability (79) all high and Regulation (53) the “soft spot.” Annual revenue per listing averages $25,288 (up 14.0% year-over-year), with an average daily rate of $126.81 (up 11.0%) and occupancy of 60% (up 1.3%). Total active listings sit at 73, up 14.1%, and family-sized homes carry the top end, such as a five-bedroom retreat close to downtown ($68K a year at 61% occupancy).
Financing note: Harpoon Capital offers industry leading DSCR Loans for properties in Norfolk and all throughout the market area. Check out our full DSCR Loans Program here, or if you want a quote on what terms look like today, fill out this two-minute form!
Sources: Zillow Home Value Index↗ · Redfin Housing Market↗ · AirDNA Market Data↗
Investor Takeaway: Norfolk offers the highest STR score in Nebraska and fast-growing nightly revenue, at prices near the state's lowest. Investors should generally buy for the long-term rent, add a nightly rental where the house suits families or work crews, and license any STR with the city before listing it.
State Fair stays and sandhill-crane season

Grand Island is home to the Nebraska State Fair, Fonner Park and the Stuhr Museum, and sits on the Platte River near the heart of the spring sandhill crane migration, with one of the best rent ratios in the article. It is the event-driven getaway market on this list – and the one where the long-term numbers look strongest!
BiggerPockets points to agriculture, manufacturing and healthcare, with JBS USA and CHI Health St. Francis among the major employers, which keeps long-term demand steady. Additionally, the State Fair each late summer, horse racing and events at Fonner Park, and crane season each spring bring waves of visitors. However, demand is event-driven rather than a classic vacation market, so revenue arrives in bursts, and First Street data on Redfin rates the flood risk as “minor” (10% of properties). On the STR side, stays carry the 5.5% state and 2% city sales taxes, the 1% state lodging tax and Hall County's 4% lodging tax, and investors should confirm licensing, zoning and any city occupation tax with the city before buying (BNBCalc).
The Grand Island submarket posts an AirDNA score of 79/100, with Rental Demand (91), Investability (82) and Seasonality (82) leading, Regulation (55) next, and Revenue Growth (50) the “soft spot.” Annual revenue per listing averages $27,014 (up 1.1% year-over-year), with an average daily rate of $149.23 (up 12.2%) and occupancy of 57% (down 12.0%). Total active listings sit at 144, up 24.1%, and group homes carry the top end, such as a six-bedroom home for large groups ($65K a year) and a house by Fonner Park.
Financing note: Grand Island deals often qualify on TTM actuals or STR revenue projections given the event-driven revenue base, and Harpoon Capital offers industry leading DSCR Loans for properties throughout the market area. Check out our full DSCR Loans Program here, or if you want a quote on what terms look like today, fill out this two-minute form!
Sources: Zillow Home Value Index↗ · Redfin Housing Market↗ · BiggerPockets Market Finder↗ · BNBCalc Nebraska STR Guide↗ · AirDNA Market Data↗
Investor Takeaway: Grand Island offers a 0.43% rent ratio and the highest appreciation figure in Nebraska, with State Fair, racing and crane-season demand on top. Investors should generally buy for the long-term rent, treat event weekends as upside, and underwrite any nightly rental on trailing twelve-month actuals given how quickly listings are growing.
| MARKET | AIRDNA SCORE |
ANNUAL REVENUE |
AVG. DAILY RATE |
OCCUPANCY | YOY LISTING GROWTH |
|---|---|---|---|---|---|
| Norfolk | 98 | $25,288 (+14.0%) |
$126.81 (+11.0%) |
60% (+1.3%) | +14.1% (73 listings) |
| Fremont | 97 | $26,774 (+24.2%) |
$138.89 (+1.8%) |
61% (+26.9%) | +11.8% (19 listings) |
| Lincoln | 92 | $29,038 (+5.9%) |
$151.92 (+3.2%) |
58% (+2.1%) | +3.8% (495 listings) |
| Grand Island | 79 | $27,014 (+1.1%) |
$149.23 (+12.2%) |
57% (-12.0%) | +24.1% (144 listings) |
| Kearney | 73 | $24,252 (-5.9%) |
$144.77 (+7.8%) |
52% (-14.2%) | +8.6% (114 listings) |
| Omaha | 67 | $29,162 (+1.4%) |
$154.48 (+0.2%) |
60% (+2.1%) | -3.4% (1,557 listings) |
Source: AirDNA, current as of 2026. Scores and figures reflect each market or submarket as defined by AirDNA and may not correspond 1:1 with city or county boundaries. As of October 2026
A few patterns stand out. Revenue per listing sits in a narrow band across all six markets, between about $24,000 and $29,000 a year, on nightly rates between $127 and $155, so the scores mostly reflect momentum and competition rather than earning power. The smaller markets, Norfolk and Fremont, score highest on fast revenue growth from small listing counts, while Omaha, the deepest market, scores lowest. Additionally, listings grew in five of the six markets, led by Grand Island (24.1%), and occupancy fell in both Grand Island and Kearney, i.e. new supply is arriving faster than demand there.
Nebraska's real estate landscape offers a strategy for nearly every type of investor:
Market-level data is a starting point, not a substitute for underwriting the specific property, neighborhood and rental strategy in front of you. Nebraska's cities cannot ban short-term rentals, but they can license and tax them, from Lincoln's $250 and Norfolk's $150 annual licenses to Kearney's permit and Omaha's 17.5% combined tax load, so investors should confirm the license and tax requirements at a specific address before they close, and check the flood map in Fremont and Lincoln.
If you are ready to invest in one of these markets, start with our Nebraska DSCR loans page.
Sources: Redfin housing market data, BiggerPockets Market Finder, Zillow Home Value Index, AirDNA market and submarket data (airdna.co), BNBCalc Nebraska STR guide, BNBCalc Omaha STR guide and the City of Kearney. Data collected as of October 2026, ahead of the 2027 investing season.
There is no statewide STR license, but hosts need a Nebraska Lodging Tax Permit, and stays carry the 5.5% state sales tax, the 1% state lodging tax, a county lodging tax (4% in each of these markets) and any local sales and occupation taxes, most of which Airbnb collects, although not Lincoln's 4% occupation tax. Some cities add their own license, e.g. Lincoln requires a $250 annual STR license, Norfolk a $150 annual license and Kearney a $100 permit renewed each year, while Omaha had no citywide STR registration as of mid-2026. State law also bars cities from banning short-term rentals outright.
No. Out-of-state and first-time investors can buy investment property in Nebraska without any license. A DSCR loan qualifies you primarily based on the property itself rather than your personal income or professional credentials, which is part of why it's such a common financing tool for out-of-state buyers.
A DSCR (Debt Service Coverage Ratio) loan qualifies a property primarily based on the property (its rent, value and location) relative to its mortgage payment, rather than the borrower's personal income or tax returns. If the property's projected or actual rent covers the mortgage payment (a DSCR of 1.00x or higher), it's generally easier to qualify, and Harpoon Capital also offers options for deals below 1.00x.
No. Under state law (Neb. Rev. Stat. § 18-1758, enacted through LB57 in 2019), a city or village may not adopt or enforce an ordinance that expressly or effectively prohibits the use of a property as a short-term rental, although it can still require licenses, set health and safety standards and collect taxes (BNBCalc). The protection does not cover unincorporated county land or HOA and condo association rules, so investors should typically check both before buying.
Harpoon Capital's DSCR loan program allows as little as 15% down on qualifying purchases, up to 85% LTV, with cash-out refinances available up to 80% LTV. Exact terms depend on the property, credit profile, and DSCR ratio. Fill out our DSCR Loan Application to see specific numbers for your deal.
Ready to Run the Numbers on a Nebraska Deal?
Whether you're eyeing Grand Island's rent ratio or a fast-moving deal in Omaha, get a same-day rate and terms with our two-minute DSCR quote form, or explore the full Nebraska DSCR Loans Program to see how we qualify the property, not just the borrower.
This article is for informational purposes only and does not constitute investment, legal, or financial advice. Harpoon Capital encourages investors to conduct independent due diligence before making any real estate investment decision.